KATY forecasts for TradingView: Katy's forecast on your TradingView chart
A Chrome extension that draws Katy's price forecast, the same model as the KATY app for iOS and Android, directly on the TradingView chart you already trade from.
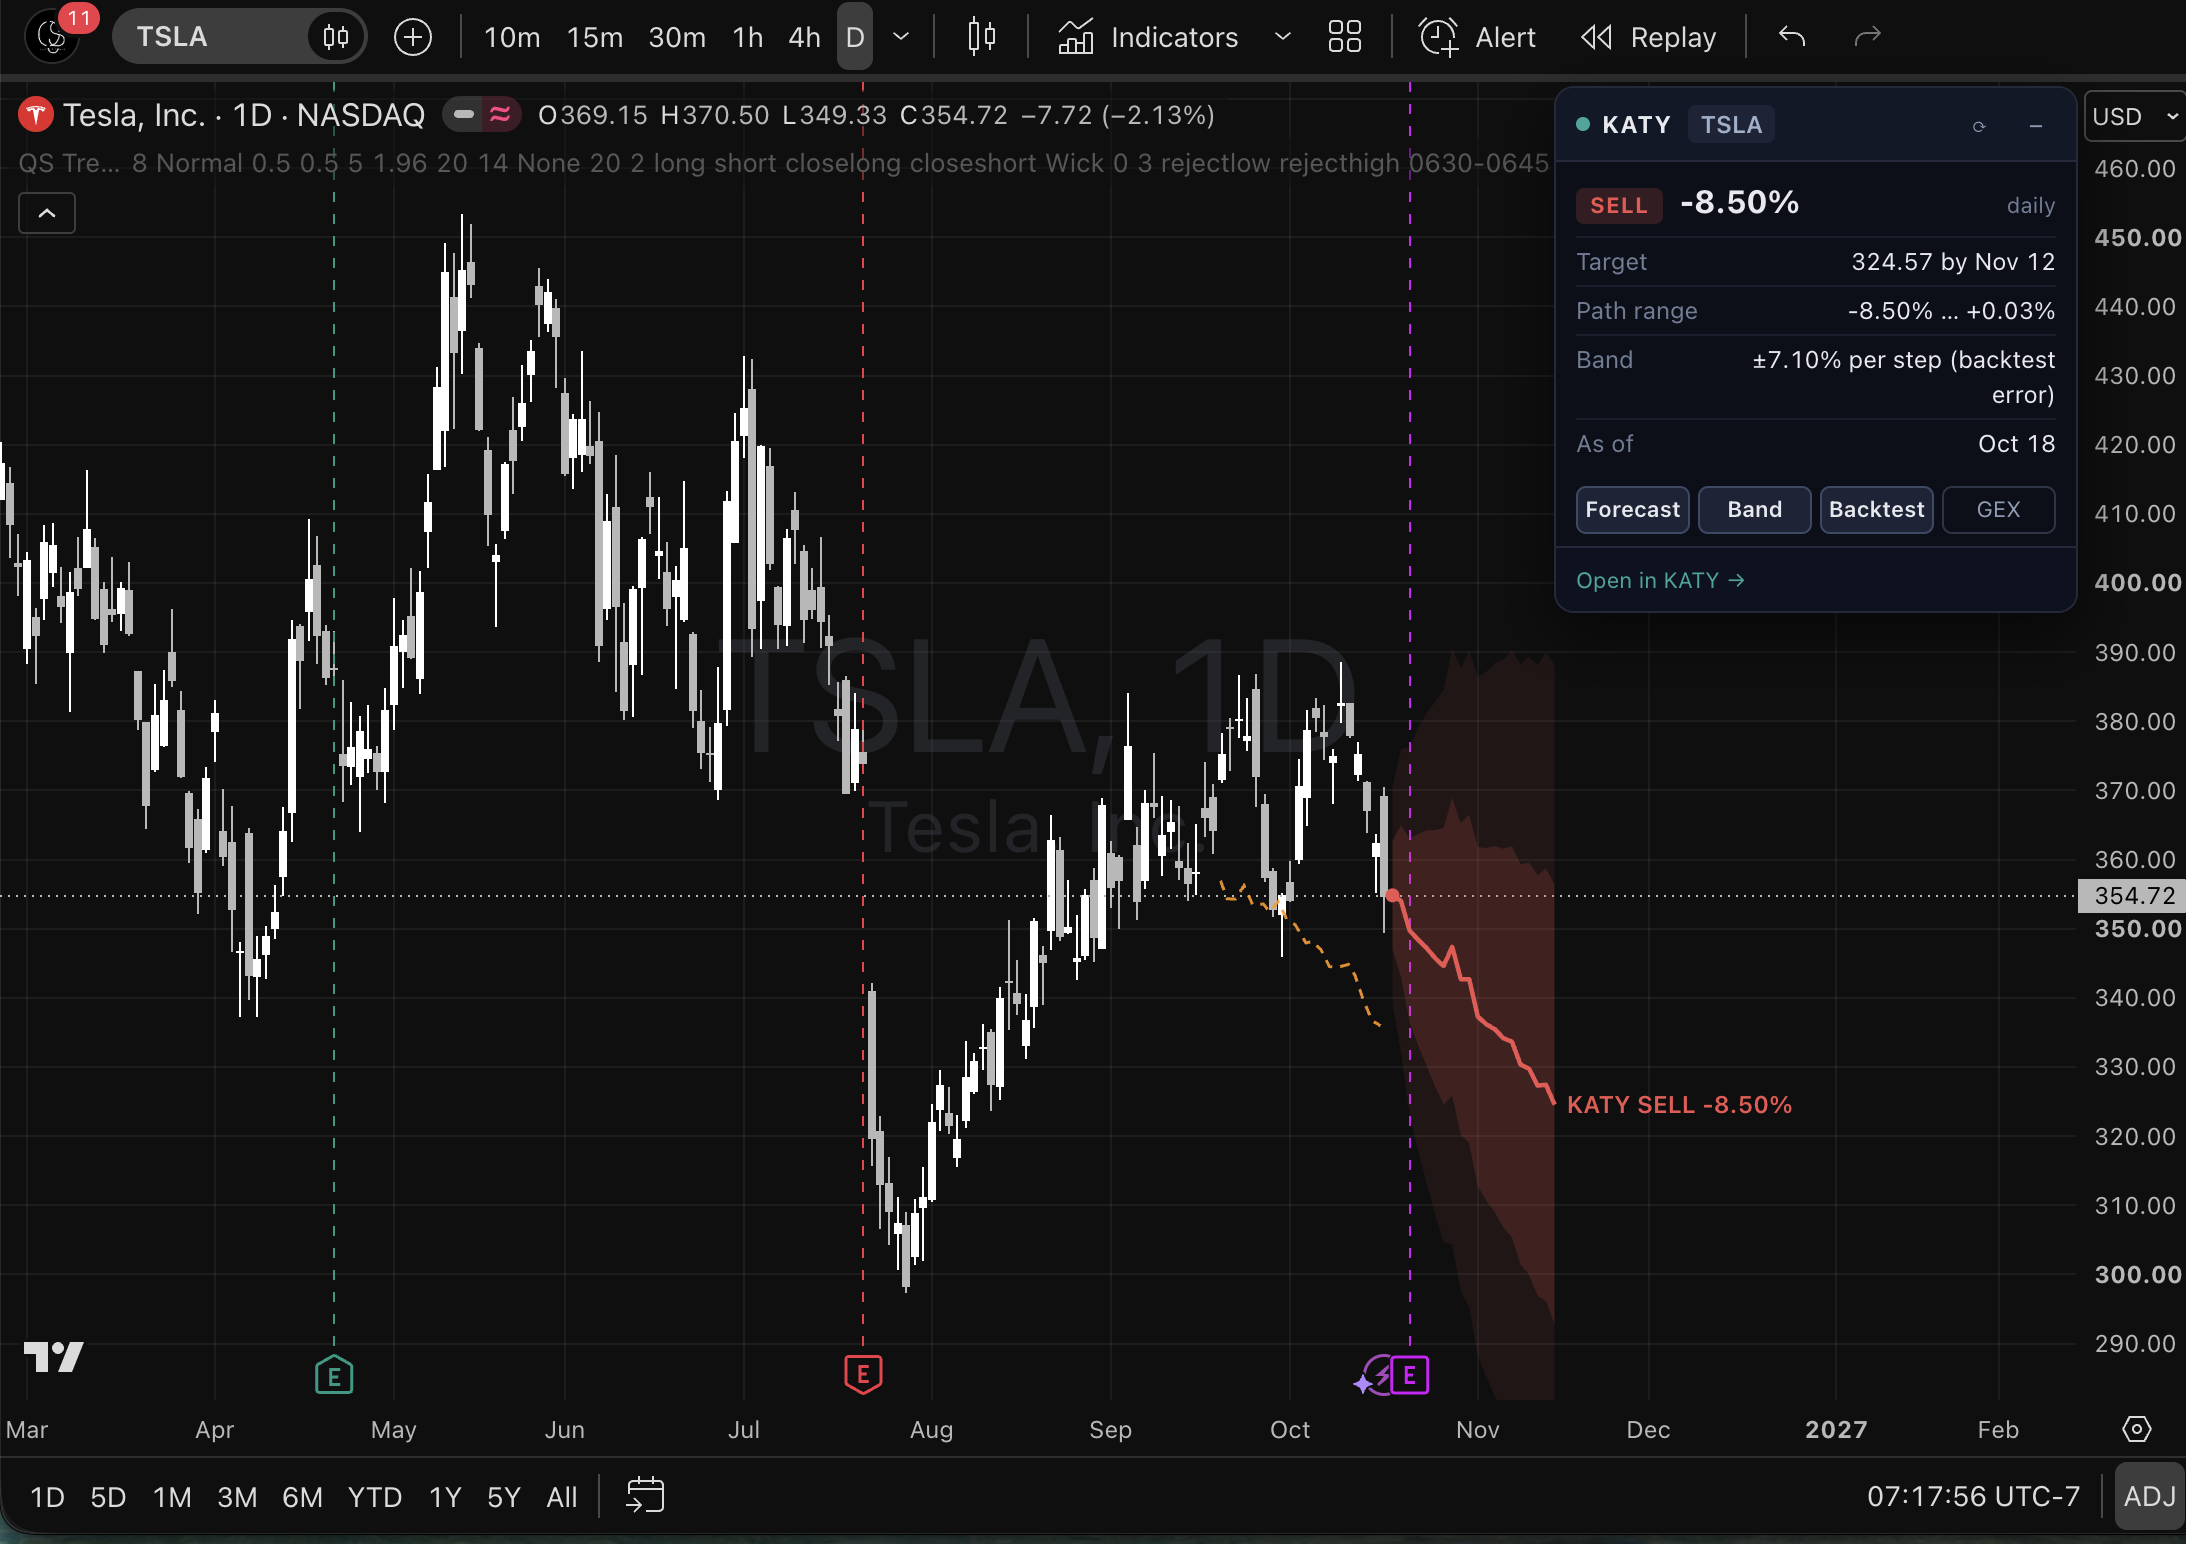
Key Takeaways
- The extension draws Katy's forward path on any TradingView chart: green for BUY, red for SELL, grey for NEUTRAL, with an end label showing the call and expected move.
- The ±1σ/±2σ band comes from Katy's own realized backtest error, widened with the square root of the horizon, and the dashed backtest line shows what Katy predicted over the recent past.
- Version 1.1 adds key levels: the GEX call wall, put wall and estimated gamma flip, the biggest dark-pool prints of the past week, and a long/short gamma regime chip.
- Coverage is US stocks and ETFs, major crypto pairs, and SPX and NDX through ETF proxies rescaled onto the index. Intraday charts get hourly forecasts; daily and slower charts get daily forecasts. Futures and forex are not covered.
- It is read-only: no orders, no broker connection, and nothing saved into your TradingView layouts. No TradingView sign-in is needed.
- Forecasts need KATY Premium or a QuantSignals Premium or Gold membership, using the same QuantSignals account as the KATY app and quantsignals.xyz.
What KATY forecasts for TradingView does
KATY forecasts for TradingView is a Chrome extension from QuantSignals. Open a TradingView chart and it follows the chart's symbol and timeframe, fetches Katy's latest forecast for that symbol, and draws it in the chart's own coordinates, so it moves with zoom and scroll and works on linear, log and percent price scales.
On the chart it draws the forward path, a ±1σ and ±2σ band built from Katy's realized backtest error, the dashed backtest line and an end label with the call and the expected move. A draggable panel shows the call, the target and its date, the path range, the band width and the as-of time, and each layer can be turned on or off. For a ticker Katy has never forecast, a Run Katy signal button runs it in about a minute and adds the ticker to the daily schedule.
The optional key-levels layer adds the GEX call wall, put wall and an estimated gamma flip, the biggest dark-pool prints of the past week near spot, and a chip showing whether dealers are long or short gamma. Everything is drawn by the extension as its own layer rather than as TradingView drawings, so it needs no TradingView sign-in and never changes your saved layouts.
The extension is read-only. It places no orders and connects to no broker. It talks only to research.quantsignals.xyz for forecasts and levels and to the QuantSignals sign-in service, keeps the sign-in token in its service worker, and has no analytics. Forecasts are model output, not financial advice.
How It Works
- Add to Chrome — Install KATY forecasts for TradingView from the Chrome Web Store.
- Sign in from the toolbar icon — Click the KATY icon and sign in with Discord, Google, Apple or email. It is the same QuantSignals account as the KATY app and quantsignals.xyz.
- Open any TradingView chart — The KATY panel appears at the top right and Katy's forecast is drawn on the chart.
Frequently Asked Questions
Is KATY forecasts for TradingView free?
The extension is free to install. The forecasts need a KATY Premium subscription or a QuantSignals Premium or Gold membership. If you already have one, sign in with the same account and there is nothing new to buy.
Does it place trades?
No. It is read-only: it places no orders, does not connect to a broker, and does not change or save anything in your TradingView layouts.
Which symbols are covered?
US stocks and ETFs, major crypto pairs (Binance and Coinbase pairs map to the USD pair, so BTCUSDT uses BTCUSD), and the SPX and NDX indices through their ETF proxies, rescaled onto the index. Intraday charts get hourly forecasts and daily or slower charts get daily forecasts. Futures and forex are not covered.
Do I need a TradingView account?
No. The forecast and key levels are drawn by the extension as its own layer on the chart, not as TradingView drawings, so they work without a TradingView sign-in.
Is my data safe?
The sign-in token stays in the extension's service worker and is never handed to the TradingView page. There is no analytics. The extension only talks to research.quantsignals.xyz, which receives the chart's symbol and timeframe to return its forecast, and to the QuantSignals sign-in service (Supabase Auth).